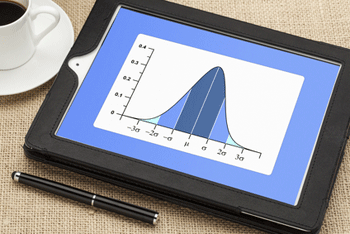
The Use of the Bell Curve in the Statistical Value Display
Researchers, analysts, and scientist survey their subjects or an audience to find out the natural inclination of the individuals. The numerical data received from such researchers are often plotted onto the graphs, and the bell curve is one of the resultant formations that the planned information makes.
Understanding the Bell Curve
Following data, the line or bar graph can take up any shape; in other words, the inserted data could be distributed out in variant ways. For example, the information could be more spread out towards the left side of the graph or on the right. It could also be jumbled up so that the line drawn in the line graph gives a chaotic appearance. This topsy-turvy display of information can also be seen in the bar graphs.
There are, however, certain other cases in which the data collected shows a widespread tendency towards the mean. It means that when the information is plotted on the graphs, the values are the highest in the middle of the horizontal. When all of these dots are connected with a line, it forms a wave-like appearance with the highest point of the wave in the center of the graph. This upward curve can also be likened to the shape of a bell, hence giving it the name of the bell curve.
Bell Curve and Normal Distribution
The bell curve is often also called the curve of Normal Distribution, where the average number of subjects share the same characteristic. For example, for the age of 16, most of the boys are measured as having a height of 5ft and a few inches. Depending on their hormones and genes, many boys will grow to a different height at different stages of their lives. However, at the age of 16, when measured, the most significant group of kids shared almost the same height.
When this information makes a graph, you can see the highest value being plotted above the center of the horizontal axis. While there would be a few with shorter heights and some with even more prominent heights, yet the highest number of kids will share the average. It is why this display is also called standard distribution curve as this height is a regular feature among candidates of this age.
Bell Curve and IQ Tests

In statistics, a bell curve has been designed as a way of establishing ‘normal distribution’ over a data range. It refers to the curve that is created, with the highest number of instances in the center building the peak of the curve and the other lesser values on either side, creating the slopes of the bell curve. IQ, as argued upon by Herrnstein and Murray is another characteristic that is likely to be represented as the bell curve when measured for a group of subjects having other things every day.
This curve also proves our interpretation that IQ tests have been exceptional in measuring gifted and disabled. However, there is a lot of a gray area where average scores are placed. In other words, they fail to measure exact development level and potentials of the ordinary people.
Other Factors That Usually Follow a Normal Distribution
There are many other factors which also follow the bell curve; things that may matter to individuals in their everyday lives. For example,
- The weight of people of certain age
- The size of objects produced by the machines
- Human error in measurements
- Blood pressure
- Characteristic traits
- Test scores
Factors Necessary to Make a Bell Curve
There are several factors which are necessary to distinguish bell curve from the other types of curves which you can use in the field of statistics. A bell curve should have only one mode, also known as median or mean and it should fall in the center of the curvature.
One important feature is that the curve formed in the bell curve is very symmetrical. So for example, if you were to draw it on a paper and then fold it in half, the distribution of data on each side of the curve should match as if mirror images.
68% of the data should fall under one standard deviation in the center. 95% of the total data should fall into the two standard deviations from the middle, and 99.7% should fall in the three differences.
What are the Uses of Bell Curve?
You can apply bell curve in many situations. For instance,
- Repeated measurements of a mechanical or electrical piece of equipment.
- Repeated measurements of the biological traits and characteristics.
- Approximating the values of chance events, like flipping a coin.
- Height and weight of students of a specific grade level.
Practice with Free IQ Tests
Share Your Thoughts!
We find value in differences between learning, interpreting and overall opinions. Please share your thoughts freely about this topic, but always remain respectful. You can preview and edit on the next page before your submission is sent in. You will also be informed about this site's privacy policies. Thank you for your contribution.
Recent Articles
-
What type of test did I take
Apr 04, 22 04:09 AM
I was given a psychological test years ago, but wasn’t told what it was for. The rating used a bell curve and my score fell in the above average not yet -
ﹰﹰﹰﹰﹰﹰﹰGOOD
Aug 13, 21 03:20 PM
Since the enneagram test helps people to understand their strength and weaknessess. And helps them remove their weaknesses then the test is good -
Knowing the inner me
Aug 13, 21 03:17 PM
Sometimes I ask myself that is this my behaviour or not? Because I am really shy and I lack confidence, I find it hard to socialize with other people.I
