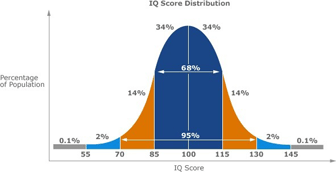
What Information Can You Interpret From an IQ Chart?
IQ chart is just a chart with a normal distribution curve. However, there is a lot that you can interpret from its construction. You can view this universal graph online and see what level your intelligence falls in – whether you are near the mean or have stepped into either side of the deviations.
But what is an IQ chart and what does it represent? How do you use the plotted information to your advantage and what does the average score mean? If you are looking for answers to these questions, then you are at the right place. Read ahead to find out more about IQ level, measurement, scale, and chart.
The Concept of IQ and IQ Scale
IQ, short of Intelligence Quotient, is a score that depicts the measure of intelligence in a particular individual. This score is derived by using a standardized testing tool or method, such as the IQ test. An IQ test is administered to a group in a controlled, supervised and prescribed environment after which the answers are evaluated to compile a score which determines the level of intelligence under which the individual is categorized.
This concept of numerically evaluating the intelligence of an individual was first introduced in the early 1900’s. Alfred Binet, a psychologist, was commissioned in 1904 by the government of France to formulate a testing system for children so that they could be differentiated intellectually. From here onwards came the ‘Binet Scale,' also known as the ‘Simon Binet Scale.'
The IQ Scale and IQ Chart

The scale was further revised by some of the following psychologists over the years, like Lewis M. Terman. The IQ level is classified in this manner,
Scores above 140 -- people who are classified as genius or almost genius
Scores from 120 – 140 -- people with very superior intelligence
Scores from 110 – 119 -- people with superior intelligence
Scores from 90 – 109 -- people with average or normal intelligence
Scores from 80 – 89 -- people with dull minds
Scores from 70 – 79 -- people with borderline intelligence
Scores under 70 -- feeble-minded people
The above listed are the levels of intelligence against which the scores of the individuals are matched after they have completed the intelligence tests. Over time, psychologists have examined the intelligence of various groups of individuals to derive the mean intelligence that the population has. By listing down the scores of all groups, they have been able to come up with a standard IQ chart that stands valid for population of most areas.
By looking at the IQ graph, one can notice the bell graph formation or the normal distribution of data on to the chart. The following assessments of IQ level can be made from this distribution of data on the graph.
- 99.5% of the scores come between the scores 60 and 140.
- 95% of the scores come between 70 and 130.
- Almost 70% of the scores come between 85 and 115.
- 50% of the scores come between 90 and 110.
The Formation of IQ Chart
From the normal distribution pattern of the IQ chart, one can learn the average IQ level of most individuals anywhere. Once you get your scores drawn out, you will instantly know whether you are graded as pretty normal or average when it comes to intelligence, or you are one of the unique ones on either side of the gradients.
Validity of Scores on IQ Chart
These scales, scores, and chart have been drawn up using the IQ tests and not just all but a particular kind. So, does that make it a valid way of assessing the intelligence of humans? Many thinkers have argued against it, stating that the tests are in one way or other, biased or invalid.
One of the reasons is that different types of tests measure the IQ level and each of these has their scale. Therefore, if two people scored a 100 on different tests using different scales, then they cannot be compared on the same scale and will not have the same amount of intelligence level. However, one thing that is common amongst most tests is that the score of 100 is regarded as average.
The score of 100 falls right in the center of the IQ Chart where the graph reaches its maximum height denoting that most people have an IQ level that is close to 100. So, most people would have a little less or a little more of 100 but are in the center deviation of the graph.
Practice with Free IQ Tests
Share Your Thoughts!
We find value in differences between learning, interpreting and overall opinions. Please share your thoughts freely about this topic, but always remain respectful. You can preview and edit on the next page before your submission is sent in. You will also be informed about this site's privacy policies. Thank you for your contribution.
Recent Articles
-
What type of test did I take
Apr 04, 22 04:09 AM
I was given a psychological test years ago, but wasn’t told what it was for. The rating used a bell curve and my score fell in the above average not yet -
ﹰﹰﹰﹰﹰﹰﹰGOOD
Aug 13, 21 03:20 PM
Since the enneagram test helps people to understand their strength and weaknessess. And helps them remove their weaknesses then the test is good -
Knowing the inner me
Aug 13, 21 03:17 PM
Sometimes I ask myself that is this my behaviour or not? Because I am really shy and I lack confidence, I find it hard to socialize with other people.I
